You are hereTemperature
Temperature
Temperature
In this Section is presented the Outputs Visualization relative to Temperature Analysis.
As shown in Figure 1, the following Section can be subdivided in four parts:
1. In the top left, the Temperature Analysis Management
2. In the bottom left, the Tree Structure of the Thermal Model relative to the selected Temperature Analysis
3. In the top right, Buttons to control the visualization of the selected Temperature Analysis
4. In the bottom right, the Area for visualization of results of the selected Temperature Analysis
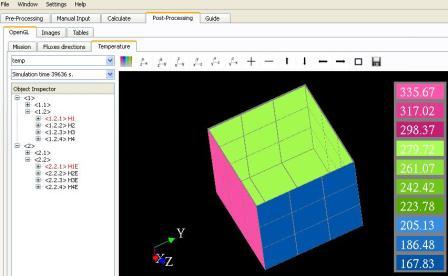
Figure 1
TEMPERATURE ANALYSIS MANAGEMENT
In this Part, there are 2 Combo Boxes.
Through the first Combo Box it is possible to select the Temperature Analysis to visualize among those available. Each time an Temperature Analysis is executed in the Tab Calculate, the name of this Analysis is inserted in this Combo Box. Each time a .SPZ file is loaded through the Menu File or the Menu Window, or a new .SPZ database is loaded, this Combo Box is updated with Temperature Analysis present in the new file.
The second Combo Box allows the choice of the Simulation point in time which to display Temperature results.
TREE STRUCTURE
The Tree Structure is relative to the Thermal Model of the selected Temperature Analysis.
Through it, it is possible to unselect the Thermal Nodes visualized in the Graphic Area.
Clicking on a branch of the Tree Structure, this branch and all its “children” are colored in red and the relative Thermal Nodes are not visualized in the Graphic Area.
For Faces with the same Thermal Node, it is sufficient that one of them is selected to visualize the relative Thermal Node in the Graphic Area.
GRAPHIC CONTROL
The Buttons (from left to right) serve to:
1. To change color of the background of Graphic Area
2. Rotation of the Output so as to have the X Axis leftward, the Y Axis upward, the Z Axis outward
3. Rotation of the Output so as to have the Y Axis leftward, the X Axis upward, the Z Axis inward
4. Rotation of the Output so as to have the Y Axis leftward, the Z Axis upward, the X Axis outward
5. Rotation of the Output so as to have the Z Axis leftward, the Y Axis upward, the X Axis inward
6. Rotation of the Output so as to have the Z Axis leftward, the X Axis upward, the Y Axis outward
7. Rotation of the Output so as to have the X Axis leftward, the Z Axis upward, the Y Axis inward
8. Zoom of Output
9. Un-zoom of Output
10. Translation of Output upward
11. Translation of Output downward
12. Translation of Output leftward
13. Translation of Output rightward
14. Restoration of initial values of translation and zoom
15. To save the Image restrained in the Graphic Area
GRAPHIC AREA
In the Graphic Area it is shown the Temperature of the Thermal Nodes trough the color. A colored Map helps the user to assess the Temperature of Thermal Nodes based on a Set of 10 colors. They are associated with the relative values of Temperature. The tern visualized, defines the System of Reference of the first Thermal Model used in Temperature Analysis.