You are hereFluxes Directions
Fluxes Directions
Fluxes directions
In this Section is presented the Outputs Visualization relative to Attitude Analysis.
As shown in Figure 1, the following Section can be subdivided in four parts:
1. In the top left, the Attitude Analysis Management
2. In the bottom left, the Tree Structure of the Thermal Model relative to the selected Attitude Analysis
3. In the top right, Buttons to control the visualization of the selected Attitude Analysis
4. In the bottom right, the Area for visualization of results of the selected Attitude Analysis
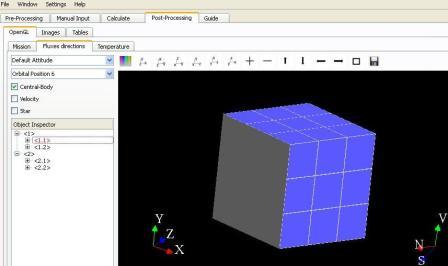
Figure 1
ATTITUDE ANALYSIS MANAGEMENT
This part comprises 2 Combo Boxes and 3 Check Boxes.
Through the first Combo Box it is possible to select the Attitude Analysis to visualize among those available. Each time an Attitude Analysis is executed in the Tab Calculate, the name of this Analysis is inserted in this Combo Box. Each time a .SPZ file is loaded through the Menu File or the Menu Window, or a new .SPZ database is loaded, this Combo Box is updated with Attitude Analysis present in the new file.
Through the second Combo Box it is possible to select the orbital position among those of Arcs used in Orbit Analysis, Input of the selected Attitude Analysis. Each time an item of this Combo Box is selected, the Thermal Model of the selected Attitude Analysis is oriented properly with respect to the Equatorial System of Reference of the Planet.
Through the 3 Check Boxes, it is possible to choose Luminosity Source of the Graphic Area between the following options:
1. Central-Body
2. Velocity
3. Star
TREE STRUCTURE
The Tree Structure is relative to the Thermal Model of the selected Attitude Analysis.
Through it, it is possible to unselect the Thermal Nodes visualized in the Graphic Area.
Clicking on a branch of the Tree Structure, this branch and all its “children” are colored in red and the relative Thermal Nodes are not visualized in the Graphic Area.
For Faces with the same Thermal Node, it is sufficient that one of them is selected to visualize the relative Thermal Node in the Graphic Area.
GRAPHIC CONTROL
The Buttons (from left to right) serve to:
1. To change color of the background of Graphic Area
2. Rotation of the Output so as to have the X Axis leftward, the Y Axis upward, the Z Axis outward
3. Rotation of the Output so as to have the Y Axis leftward, the X Axis upward, the Z Axis inward
4. Rotation of the Output so as to have the Y Axis leftward, the Z Axis upward, the X Axis outward
5. Rotation of the Output so as to have the Z Axis leftward, the Y Axis upward, the X Axis inward
6. Rotation of the Output so as to have the Z Axis leftward, the X Axis upward, the Y Axis outward
7. Rotation of the Output so as to have the X Axis leftward, the Z Axis upward, the Y Axis inward
8. Zoom of Output
9. Un-zoom of Output
10. Translation of Output upward
11. Translation of Output downward
12. Translation of Output leftward
13. Translation of Output rightward
14. Restoration of initial values of translation and zoom
15. To save the Image restrained in the Graphic Area
GRAPHIC AREA
In the Graphic Area there are two Terns and the Thermal Model used in the Attitude Analysis selected in the first Combo Box.
The first Tern represents the Equatorial System of Reference of the Planet.
The second Tern, whose directions of the axis, with respect to the System of Reference defined by the First Tern, are updated each time an Orbital Position is selected trough the second Combo Box from high, indicates the directions of the following vectors in the Equatorial System of Reference of the Planet:
1. V=Velocity: Velocity Direction
2. S=Sun: Direction joining the Origin of the System of Reference of the Thermal Model with the Sun
3. N=Nadir: Direction joining the Origin of the System of Reference of the Thermal Model with Planet Centre
The two sides of the Faces of the Thermal Model are Blue if the relative Instance has “Both” value for “Side” parameter, otherwise they are one Gray (Side Off) and one Blue(Side Active).
Further condition so that Sides of the Faces are Blue and not Gray is that at least one of the scalar products of the normal to the Side of the Face and the directions indicated by the checked Check Boxes is negative (Illuminated Side).
Faces mutual obscuration is not taken into account, thing that will be considered in GR and Fluxes Analysis.