You are hereImages
Images
Images
This Section assumes to visualize data of analysis trough Images.
The Combo Box above in Figure 1 allows to choice the set of data to Post-Process between Mission, Fluxes and Temperature Analysis.
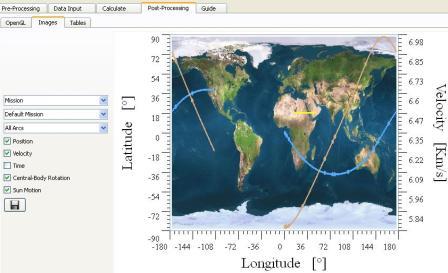
Figure 1
MISSION
The Figure allows to visualize the trace of the Orbit of the Satellite over the Planet.
On X axis it is shown the Longitude, while over Y axes Latitude, Velocity an Time are shown.
The Image of the Planet belongs to the set of Planet Data defined in the Orbit Section.
The Second Combo Box from high identifies the Mission Analysis whose data are visualized in Figure 1.
The Third Combo Box from high allows the choice the Arc to visualize and as first option shows the visualization of all Arcs of Analysis Mission together.
Position, Velocity an Time can be visualized. Only 0, 1 or 2 Check Box can be checked simultaneously among the top three.
Check Box “Central-Body Rotation” allows to visualize the effective trace ot the Orbit of the Satellite over the Planet, considering Planet Rotation.
If it is checked, it activates the visualization of the Check Box “Sun Motion”, thanks to which it is possible to visualize the trace of the Sun over the Planet.
It is possible to save the Image with the responsible Button.
FLUXES and TEMPERATURE
The following considerations apply to the visualization through Images of results of Fluxes and Temperature Analysis.
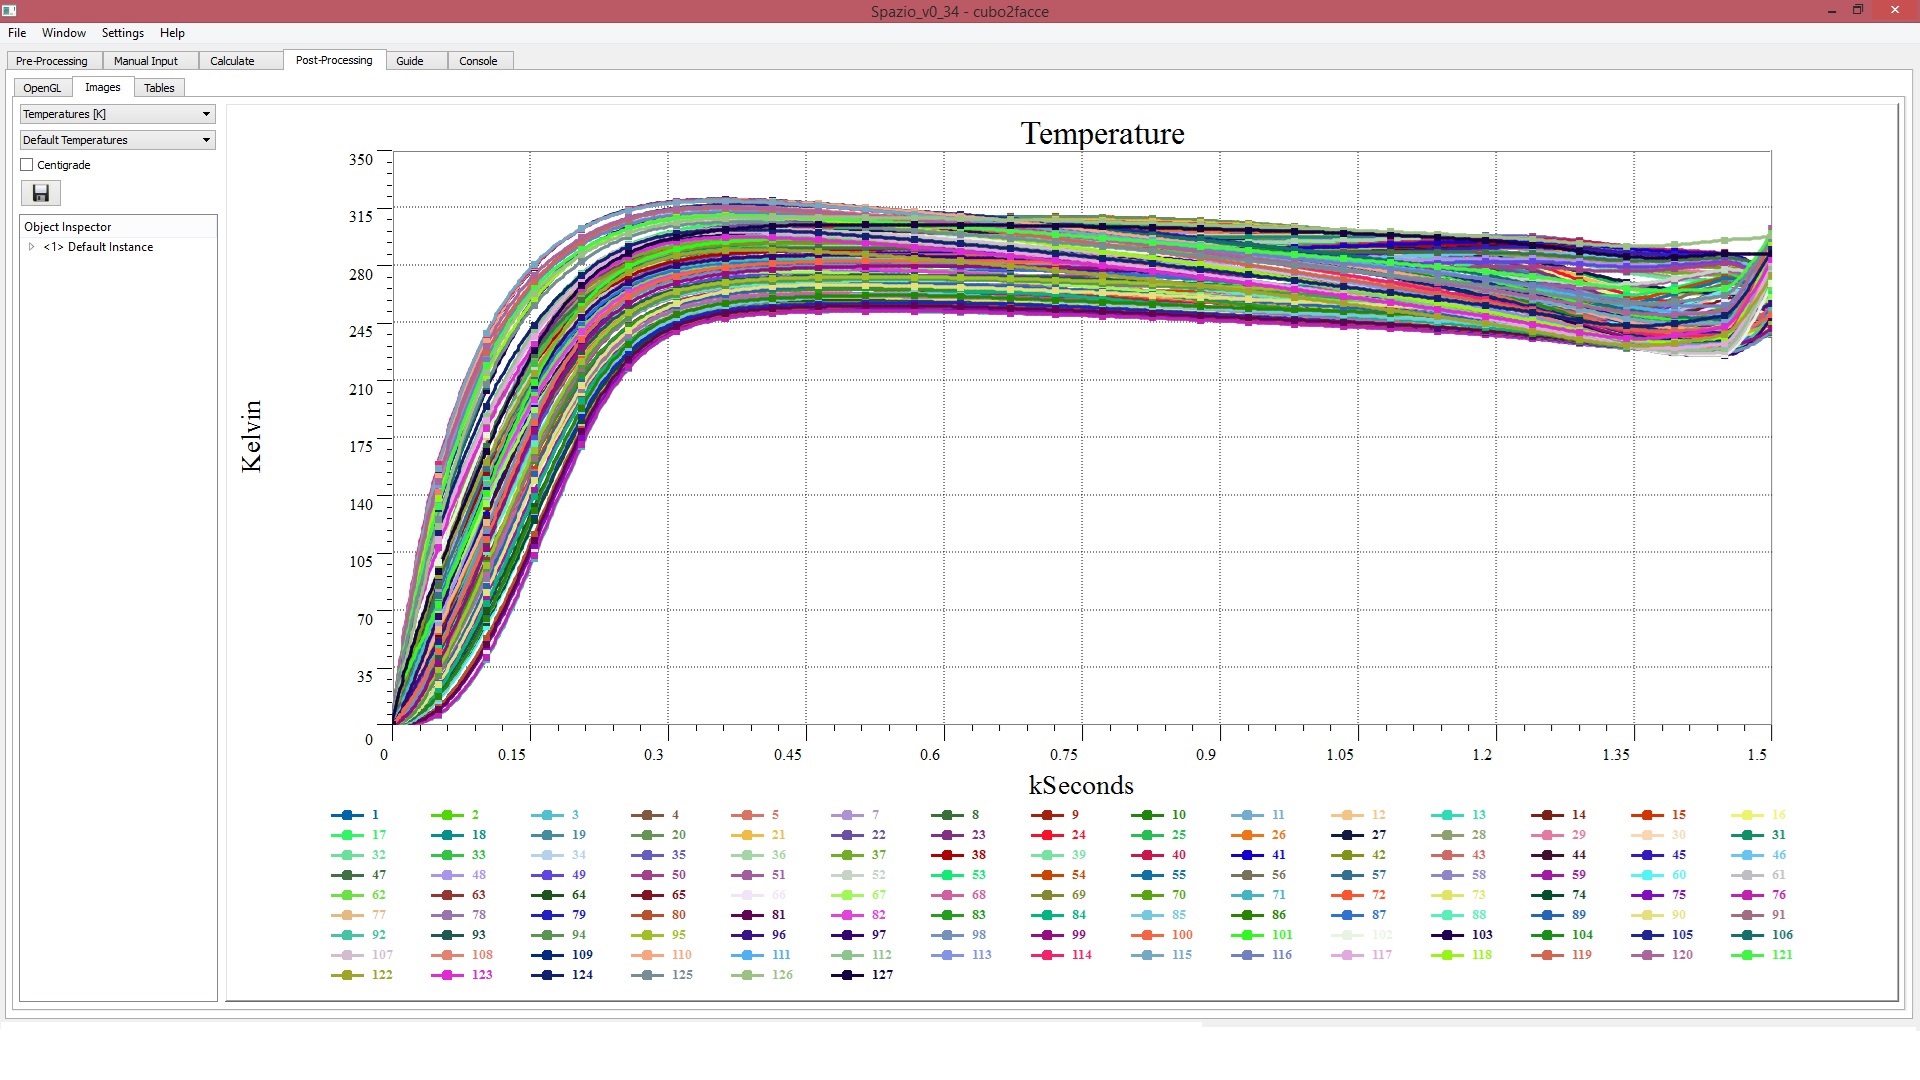
Figure 2
The Second Combo Box from high allows the choice of the Anlysis to Post-Process between those available of the type indicated in the First Combo Box from high.
Only in the Fluxes case it is available a Third Combo Box that allows to choice between the sets of Fluxes to visualize:
1. Planet
2. Albedo
3. Sun
4. Planet + Albedo
5. Planet + Sun
6. Albedo + Sun
7. Total
Over the X Axis it is reported the Simulation Time, while over the Y Axis Fluxes[W] or Temperatures [K].
Each Line has a different color. Squares represent the solutions in the moments relative to the Orbital Position chosen in the Orbit Section.
The legend associates to each Thermal Node the color used in the Figure.
The tree structure is that of the Thermal Model/Models used in simulations.
Through it, it is possible to deselect Thermal Nodes visualized in the Figure.
Clicking over a branch of the tree structure, this branch and all children are colored in red and respective Thermal Nodes are not shown in Figure.
For Faces of the same Thermal Node, it is sufficient that only one of them is not selected to visualize the respective Thermal Node.
It is possible to Save Images with responsible Button.